📊ap statistics review
5.8 Sampling Distributions for Differences in Sample Means
Verified for the 2025 AP Statistics exam•Last Updated on June 18, 2024
Formulas
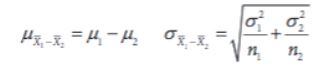
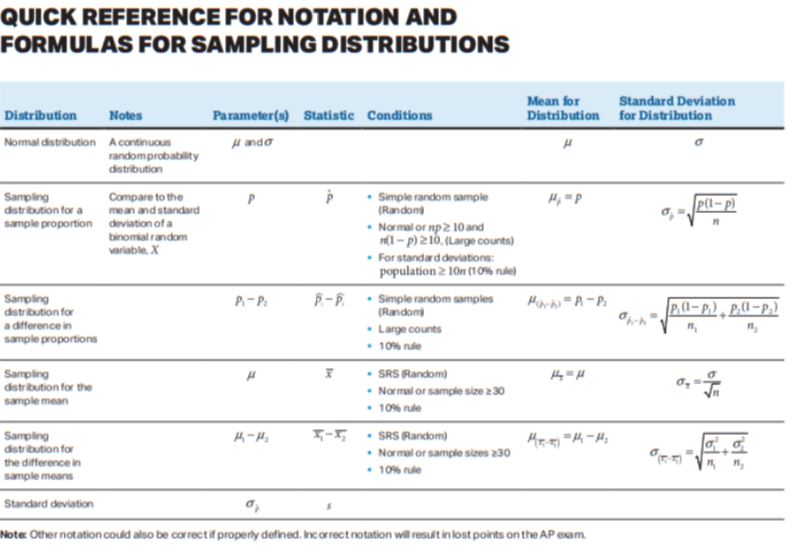
To find the standard deviation of differences in sample means, divide the variances by each sample size before square rooting to find the overall standard deviation. Just like with proportions, the “Pythagorean Theorem of Statistics” applies to sampling distributions for the difference in two means as well. Here are the formulas for the needed parameters for sampling distribution of difference of two means. 🕯️
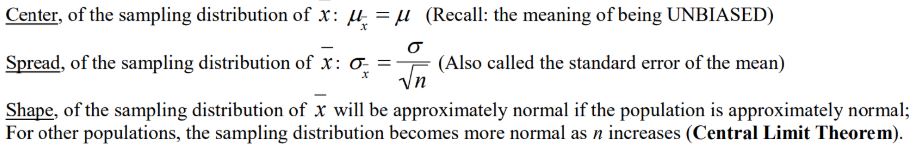
Normal Condition: Central Limit Theorem
When you are working with differences between sample means, you can use the sampling distribution of the differences to make inferences about the difference between the population means. 🙌
If the two population distributions can be modeled with a normal distribution, then the sampling distribution of the difference in sample means x̄1 - x̄2 can also be modeled with a normal distribution. This means that you can use statistical techniques that rely on normality, such as confidence intervals and hypothesis tests, to make inferences about the difference between the population means based on the sample data.
If the two population distributions cannot be modeled with a normal distribution, the sampling distribution of the difference in sample means x̄1 - x̄2 can still be approximately normal if both samples are large enough. This is due to the Central Limit Theorem, which states that the sampling distribution of the sample mean becomes approximately normal as the sample size increases, regardless of the shape of the population distribution. As a result, if both samples are large enough (e.g., have sample sizes of at least 30), you can still use normal-based techniques to make inferences about the difference between the population means. 🎈
Practice Problem
Suppose that you are a publisher trying to compare the sales of two different genres of books: romance novels and science fiction novels. You decide to use random samples of 50 romance novels and 50 science fiction novels from your inventory, and you collect data on the number of copies sold for each book. After analyzing the data, you find that the sample mean number of copies sold for romance novels is 500 copies with a standard deviation of 100 copies, and the sample mean number of copies sold for science fiction novels is 400 copies with a standard deviation of 150 copies. 📚
a) Explain what the sampling distribution for the difference in sample means represents and why it is useful in this situation.
b) Suppose that the true population mean number of copies sold for romance novels is actually 550 copies and the true population mean number of copies sold for science fiction novels is actually 450 copies. Describe the shape, center, and spread of the sampling distribution for the difference in sample means in this case.
c) Explain why the Central Limit Theorem applies to the sampling distribution for the difference in sample means in this situation.
d) Discuss one potential source of bias that could affect the results of this study, and explain how it could influence the estimate of the difference in population means.
Answer
a) The sampling distribution for the difference in sample means represents the distribution of possible values for the difference between the sample means if the study were repeated many times. It is useful in this situation because it allows us to make inferences about the difference between the population means for the two genres of books based on the sample data.
b) If the true population mean number of copies sold for romance novels is 550 copies and the true population mean number of copies sold for science fiction novels is 450 copies, the sampling distribution for the difference in sample means would be approximately normal with a center at 550 - 450 = 100 copies and a spread that depends on the sample sizes and the variability of the populations.
c) The Central Limit Theorem applies to the sampling distribution for the difference in sample means in this situation because the sample sizes (n1 = 50 > 30, and n2 = 50 > 30) are large enough for the distribution to be approximately normal, even if the populations are not normally distributed.
d) One potential source of bias in this study could be self-selection bias, which occurs when certain groups of individuals are more or less likely to choose to participate in the study. For example, if romance novel readers are more likely to buy books from certain retailers or to be members of certain book clubs, the sample of romance novels could be biased toward higher levels of sales and produce an overestimate of the population mean.
On the other hand, if science fiction novel readers are more likely to buy books online or to be members of certain online communities, the sample of science fiction novels could be biased toward lower levels of sales and produce an underestimate of the population mean. This could lead to an incorrect estimate of the difference in population means between the two genres of books.