Find gaps with guided practice

Table of Contents
📊ap statistics review
6.10 Setting Up a Test for the Difference of Two Population Proportions
Verified for the 2025 AP Statistics exam•Citation:
Another way to check a statistical claim is to perform a significance test for the difference in two population proportions. As with any significance test, we have to write hypotheses, check our conditions and then calculate and conclude. 📲
Still lost? Let's do a refresher!
A statistical significance test is used to determine whether the difference between two population proportions is statistically significant, or whether it could have occurred by chance.
To perform a significance test for the difference in two population proportions, you need to first write your null and alternative hypotheses. The null hypothesis states that there is no difference between the two population proportions, while the alternative hypothesis states that there is a difference.
Next, you need to check that the conditions for the test are met. These include having a large enough sample size and having a random and independent sample.
Once you have checked the conditions, you can calculate the test statistic and determine the p-value. The p-value is the probability of obtaining a test statistic as extreme as the one observed, given that the null hypothesis is true. If the p-value is less than the significance level (usually 0.05), you can reject the null hypothesis and conclude that the difference between the two population proportions is statistically significant. If the p-value is greater than the significance level, you cannot reject the null hypothesis and must conclude that the difference is not statistically significant. 😄
Hypotheses and Parameters
The first thing we need to do when setting up a significance test for the difference in two population proportions is to write out our hypotheses. Our null hypotheses will always have our two population proportions being equal, while our alternate has them either greater than, less than or not equal to each other. 🏆
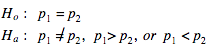
It is also important in this stage of setting up the test to identify what p1 and p2 represent. We have to define our parameters so the reader knows what we are truly comparing.
Conditions
We also must check our conditions for inference. The same three conditions apply as did for confidence intervals with one little small change in the normal check.
(1) Random
Probably the most important condition is that we need to be sure that both of our samples come from random samples. If we don't take a random sample from our population, then our findings suffer from sampling bias and we are stuck and we can't generalize our findings to our population. 😞
(2) Independence
To check that our sample is independent, we need to make sure that both of our populations are at least 10 times that of our samples. Also, if we are dealing with a randomized experiment, the random assignment of treatments classifies our samples as independently selected. 🔟
(3) Normal
When dealing with proportions, we always check our normal condition by using the Large Counts Condition, which states that our expected successes and failures is at least 10. With a 2 proportion z test, we have to combine our proportions to create a combined p-hat. This is what we use to find our expected failures and successes. 🎩

Then we have to verify that each of our expected failures and successes are at least 10.

This is because we are using a pooled sample. In this test, you combine the two samples into a single "pooled" sample and calculate a single proportion for the combined sample. The test statistic is then calculated based on the difference between the two proportions and the pooled sample proportion. 🏊
Example
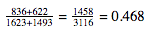
Let's return to our MJ vs. Lebron problem from earlier... again. Recall that MJ made 836/1623 shots and Lebron made 622/1493 shots. Instead of testing this claim with a confidence interval, let's test it using a 2 Prop Z Test to verify our results. 🏀
Hypotheses and Parameters
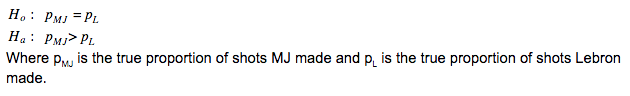
Another great idea when writing our hypotheses is to use meaningful subscripts such as MJ and L that clarify which proportion matches which population.
Conditions
- Random: Even though the problem never stated that they were random (and we discussed the problems with this in Unit 6.9) we are going to assume it is random.
- Independent: It is reasonable to believe (and obviously true) that MJ took at least 16, 230 shots in his career and Lebron took at least 14,930 shots in his career, so the samples are independent.
- Normal: This is the one that will be a bit different. First, we have to calculate our pooled p-hat. Using the formula above, we get 0.468
Next, we have to check our large counts condition using this pooled p-hat.
- 1623 (0.468) > 10 ✔️
- 1623 (0.532) > 10 ✔️
- 1493 (0.468) > 10 ✔️
- 1493 (0.532) > 10 ✔️
Now that we have checked conditions, we are ready to calculate and test our claim. 🧪
🎥 Watch: AP Stats - Inference: Hypothesis tests for Proportions