
📊ap statistics review
6.7 Potential Errors When Performing Tests
Verified for the 2025 AP Statistics exam•Citation:
What is an Error?
No matter how well we design our test, perform our calculations and follow our correct procedures, we are still prone to error in our tests. This doesn't necessarily mean we did something wrong in our sampling or our calculations, but just that our calculations gave us an incorrect result. We always have that small random chance of achieving a rare sample that leads us to incorrect results and there are ways that we can minimize this effect. 🍀
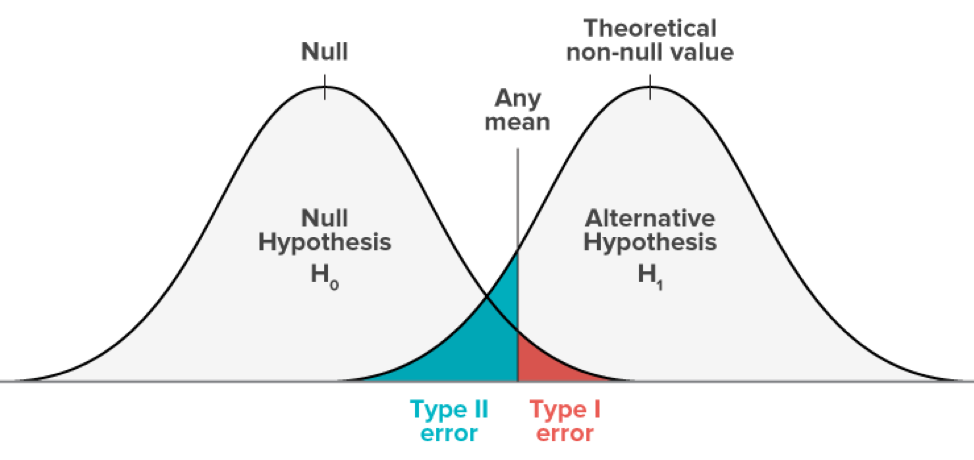
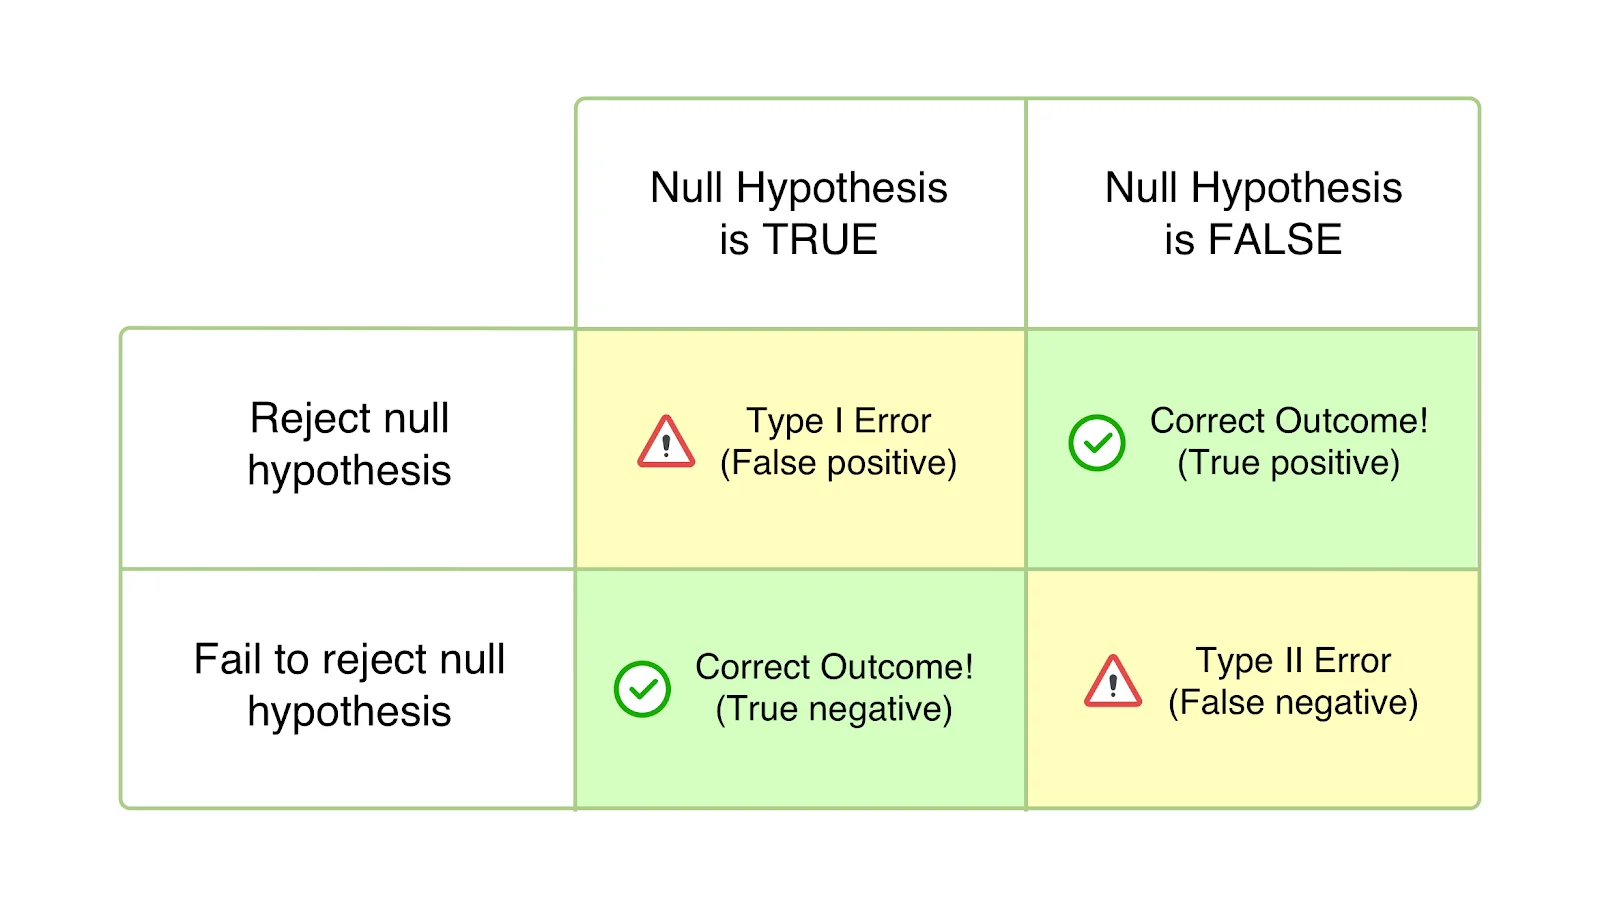
In inferential statistics, there are two types of errors that can occur in a hypothesis test: type I error and type II error.
Type I Error
A type I error occurs when we reject the null hypothesis when it is actually true. This error is also known as a "false positive." This is due to a low p-value that lead us to make a decision, but actually we drew an extremely rare sample from our population. The probability of a type I error is represented by the significance level α, which is the probability that we will reject the null hypothesis when it is true. In general, we set α to be a small value, such as 0.01 or 0.05, in order to minimize the probability of a type I error. ➕
Type II Error
A type II error occurs when we fail to reject the null hypothesis when it is actually false. This error is also known as a "false negative." This is due to the fact that we did not get a low enough p-value to reject our Ho, but in reality, our Ho is not the truth and there should have been convincing evidence for Ha. The probability of a type II error is represented by β, which is the probability that we will fail to reject the null hypothesis when it is false. ➖
Again, 0.05 is a good significance level that minimizes the probability of making this type of error, while also being sure that our calculations obtained are still statistically significant. The probability of making a Type 2 Error is 𝞫. This is easy to remember because the probabilities of a Type 1/2 Error are alpha/beta respectively.
The probability of a Type II error decreases when any of the following occurs, provided the others do not change:
- Sample size(s) increases.
- Significance level (α) of a test increases.
- Standard error decreases.
- True parameter value is farther from the null.
Power
There are several ways that we can minimize the probability of both type I and type II errors. One way is to use a larger sample size, as this can increase the power of the test, which is the probability of correctly rejecting the null hypothesis when it is false. We can also choose a more stringent significance level, such as α = 0.01, in order to decrease the probability of a type I error. However, this also increases the probability of a type II error (1 - power). 👊
A significance level of 0.05 is usually a good middle ground that minimizes type II error, but also keeps us from making other errors in our study.
The complement of 𝞫 is known as the power of our test. The power is basically a way of saying how strong our test is because it is the probability of NOT making a Type 2 error. We can increase our power by increasing our sample size. Remember, the larger our sample, the closer our estimate is the population parameter, so the less likely we are to make a mistake.
Test Pointers
Common AP Test questions regarding types of errors and power typically ask the following questions: 🤔
Identify Error
The first thing AP is likely to ask is how to identify either a Type 1 or 2 error. This is basically writing out the definitions above in context of the given problem. Learn the definitions using the trick above and this part is easy.
Consequence of Error
Past AP Statistics tests also loved asking about the consequence(s) of an error. If we rejected a null hypothesis when we shouldn't have, what are the consequences (in context) of making such an error?
Increase Power
The last thing that AP likes to ask about regarding errors and power is how we can increase power. The answer is always to increase sample size.
Example

In a recent study, a researcher was testing the claim that 85% of people are satisfied with their current personal reading goals and achievements. The researcher has reason to believe that this proportion is lower and that people are actually not happy with their personal reading plans and need a new library to borrow from. Therefore, the researcher tests the following hypotheses to see if opening a new public library would help people reach their personal reading goals:
Ho: p = 0.85
Ha: p < 0.85
a) Describe a Type 2 error in context of the problem. Also, list a consequence of making this type of error.
If the researcher makes a Type 2 error in this problem, he/she has failed to reject the Ho, when in fact it should be rejected. This means that the researcher concluded that we did not have evidence that the true population proportion was less than 0.85, when in fact, there is convincing evidence that it is less than 0.85. A consequence of this error is that people will likely remain largely unhappy with their reading achievement when a new library may help them reach their reading goals.
b) What can the researcher do to increase the power of this test?
The researcher can increase the power of this test and therefore decrease the probability of making a Type 2 error by increasing the sample size in the study.
🎥 Watch: AP Stats - Inference: Errors and Powers of Test