📊ap statistics review
2.5 Correlation
Verified for the 2025 AP Statistics exam•Last Updated on June 18, 2024
Correlation is a measure of the strength and direction of the relationship between two variables, and this is numerically represented with the correlation coefficient, which in stats we denote as r.
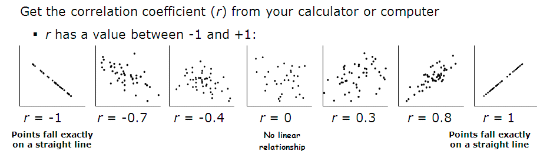
The correlation coefficient shows the degree to which there is a linear correlation between the two variables, that is, how close the points are to forming a line. It can be positive or negative and this is the same as the direction of the scatterplot. The coefficient takes a value between -1 and 1, where r = -1 means that the points fall exactly on an decreasing line while r = 1 means that the points fall exactly on a increasing line. A correlation coefficient of 0 means that there is no correlation between the data points. 🌞
It's important to note that the correlation coefficient only measures the linear relationship between two variables. It does not indicate the strength or nature of any nonlinear relationships that may exist. Additionally, the correlation coefficient does not indicate the cause and effect relationship between the two variables. As mentioned before, correlation =/= causation! 🙅
Examples
Here are some scatterplots and their values of r:
Also, there are a few things to keep in mind about correlation.
- Even if r has a high magnitude, the relationship may not be linear, but instead it may be curved. We'll discuss this more in later sections.
- A high magnitude of correlation does not imply causation.
- The correlation coefficient is not resistant to outliers, which makes sense, given that the formula that we shall learn uses the mean and standard deviation, which by themselves are not resistant.
Calculating the Correlation Coefficient
To find the value of r, we have this formula that is found on the formula sheet:
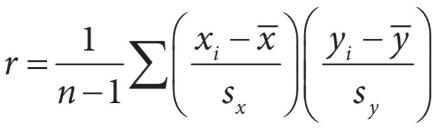
Although this may seem like a complicated formula, it’s not that bad to understand (but harder to compute) To find r, first find the mean and standard deviations of both the x and y variables. Then, for each data point, multiply the x and y z-scores for that point. Finally, add all the individual products up and divide by the number of data points minus 1. 💫
You will seldom need to do this by hand, and most graphing calculators can easily find this. On the most common graphing calculator used in AP Stats (TI-84), you will enter your data into L1 and L2, go to Stats>Calc>LinReg like below:
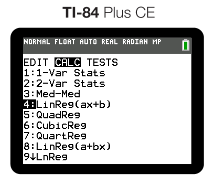
To be sure that you get the r-value, verify that "Stats Diagnostics" is on via MODE.
🎥 Watch: AP Stats - Scatterplots and Association
Practice Problems
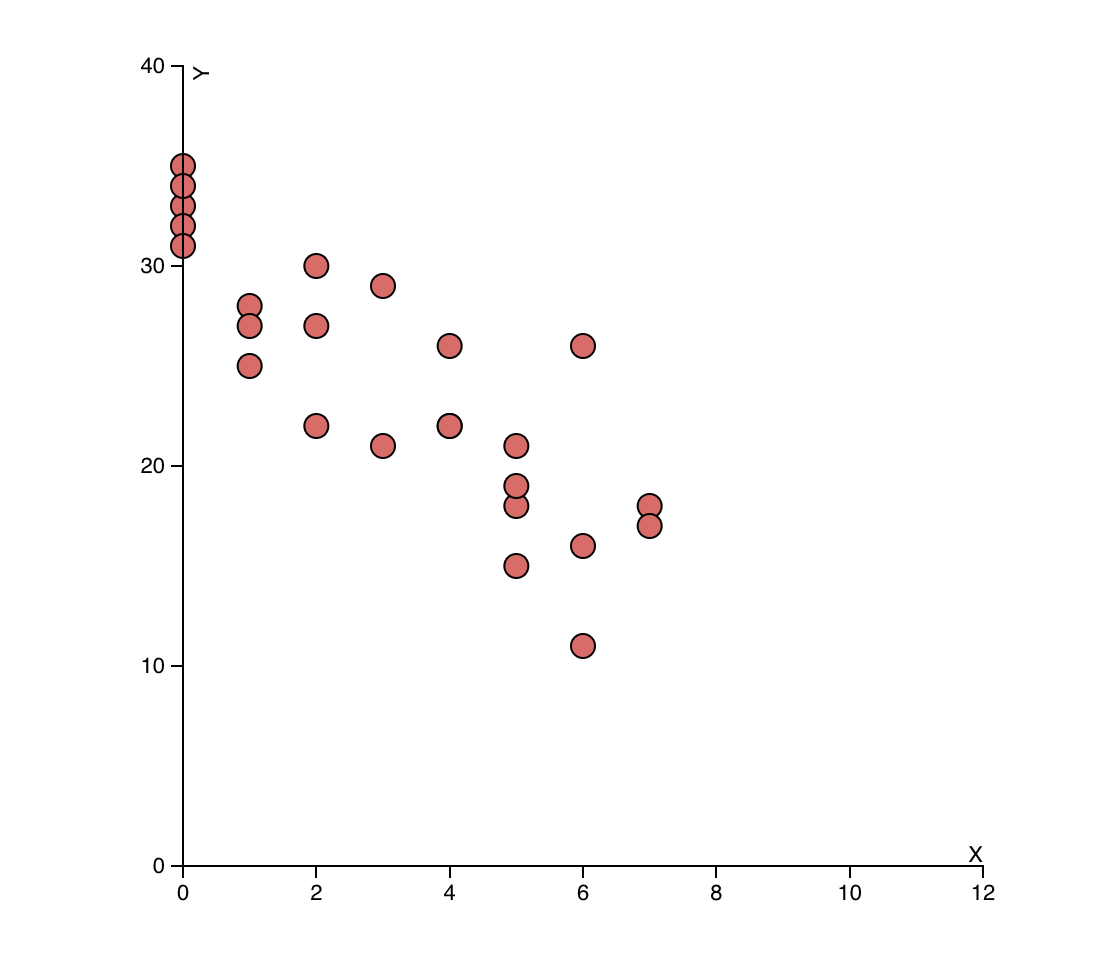
(1) A study was conducted to examine the relationship between hours of exercise per week and body mass index (BMI). The following scatterplot shows the results of the study for a sample of 25 individuals.
Based on the scatterplot, which of the following statements is true?
(A) There is a strong positive correlation between hours of exercise per week and BMI.
(B) There is a strong negative correlation between hours of exercise per week and BMI.
(C) There is a moderate positive correlation between hours of exercise per week and BMI.
(D) There is a moderate negative correlation between hours of exercise per week and BMI.
(E) There is no correlation between hours of exercise per week and BMI.
(2) TRUE or FALSE
- A scatterplot is a graphical representation of the relationship between two variables.
- A correlation coefficient of 1 indicates a strong positive correlation between two variables.
- A correlation coefficient of -1 indicates a strong positive correlation between two variables.
- A correlation coefficient of 0 indicates no correlation between two variables.
- The correlation coefficient only measures linear relationships between two variables.
- The correlation coefficient indicates the strength and direction of the relationship between two variables.
- The correlation coefficient indicates the cause and effect relationship between two variables.
- Correlation implies causation, meaning that if two variables are correlated, one variable must cause the other.
- A scatterplot can show nonlinear relationships between two variables.
- A scatterplot can be used to predict the value of one variable based on the value of the other variable.
Answers
(1) In this case, the correct answer would be (D) There is a moderate negative correlation between hours of exercise per week and BMI. This can be seen from the scatterplot, which shows that as the hours of exercise per week increase, the BMI decreases. The relationship between the two variables is not perfectly linear, but there is a clear trend in the data. The correlation coefficient could be calculated to quantify the strength of this relationship.
(2) T, T, F, T, T, T, F, F, T, T
[
](https://app.fiveable.me/ap-stats/unit-2/scatterplots-association/watch/KqjaqR3xVBs7M1J6oHJN)[](https://maths.nayland.school.nz/Year_13_Maths/3.9_Bivariate_data/7_Corr_Coefficient_r.html)