AP Macroeconomics
One-page, printable cheatsheet
Cheatsheet visualization
Table of Contents

💶ap macroeconomics review

1.5 Supply

Verified for the 2025 AP Macroeconomics examCitation:

Supply is the different quantities of goods and services that firms are willing and able to produce at various price levels. Understanding the relationship between supply and demand is crucial to determine the equilirium price.

Quantity Supplied vs. Supply

Quantity supplied is the amount of a good or service that is produced at a particular price level.

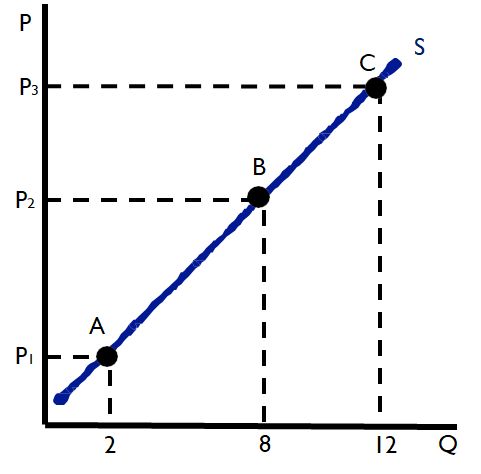
Below is a supply curve. Quantity supplied is one point on the curve (i.e. A, B, or C), and supply is the entire line, including all of the points that create it.

Law of Supply

The law of supply states that the relationship between the price level and the quantity demanded of a good or service is direct, or positive. As the price level rises, firms are more willing or more able to produce a greater quantity, and, therefore, produce more. As the price level falls, firms are less willing or less able to produce the same quantity, and, therefore, produce less.

In summary:

  • When price level increases, the quantity of a good supplied increases.
  • When price level decreases, the quantity of a good supplied decreases.

Using the chart above, when the price rises from P1 to P2, the quantity supplied increases from 2 units to 8 units. When the price drops from P3 to P2, the quantity supplied decreases from 12 units to 8 units.

💡The only thing that changes quantity supplied is the price of the good or service.

Let's take a look at another graph: 

In the graph above, it is possible to observe that point 🅰️ has a price of $100 and a quantity supplied of 50. 

When the price increases from $100 to $110 at point 🅱️ the quantity supplied also increases to 90. This exemplified the positive relationship between supply and price. 

Determinants of Supply

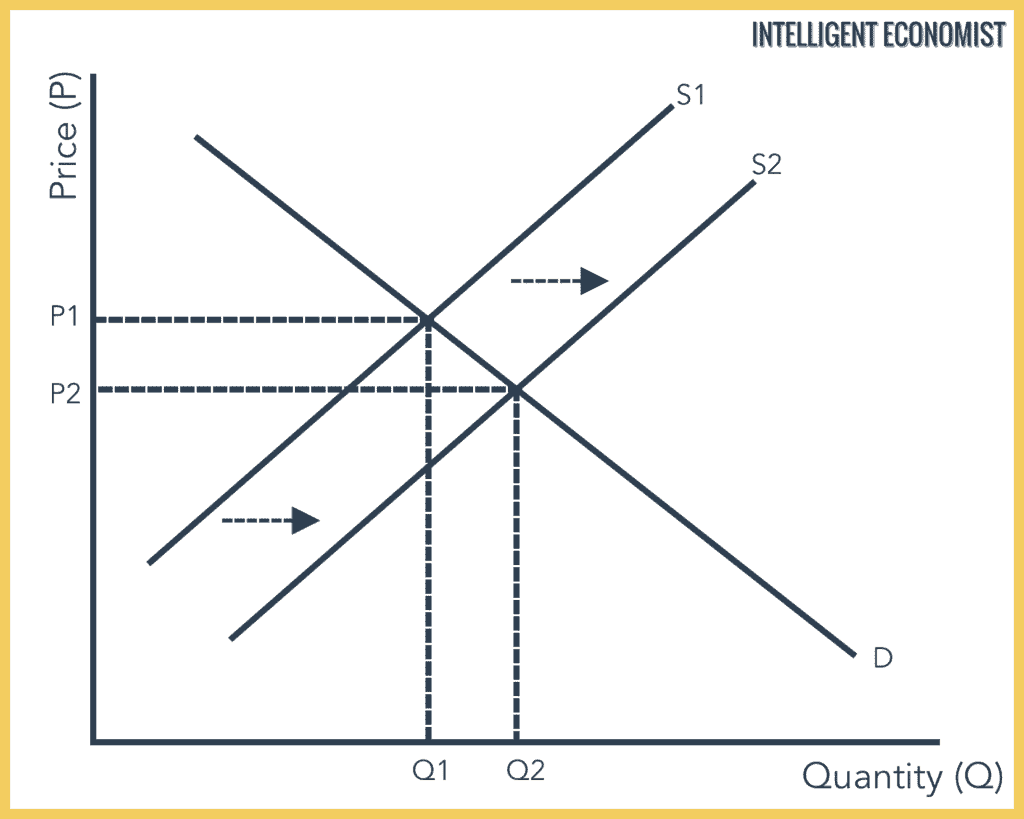
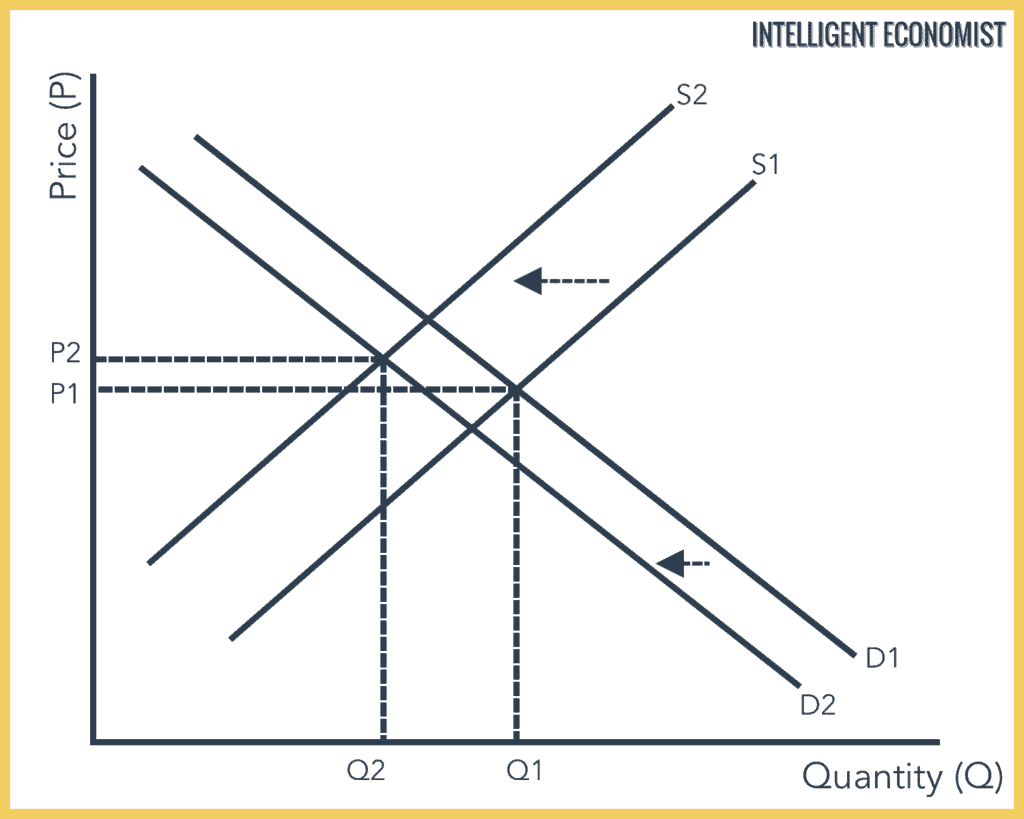
Determinants are factors that can cause the entire supply curve to increase or decrease. When there is an increase in supply (see graph below), the supply curve will shift to the right. At every price level, there is an increase in quantity supplied. When there is a decrease in supply (see graph below), the supply curve will shift to the left. At every price level, there is a decrease in quantity supplied.

There are several determinants of supply that cause the shift to the right (increase in supply) or the shift to the left (decrease in supply). We are going to use the acronym R-O-T-T-E-N as a way to remember all of the determinants.

  • R - Resources
  • O - Other good prices
  • T - Taxes
  • T - Technology
  • E - Expectations of the supplier
  • N - Number of competitors

If supply increases (shift to the right) it could be due to the following changes:

  • R - Resources increase ⬆️
  • O - Other good prices' decrease ⬇️
  • T - Taxes (and other government regulations) decrease ⬇️
  • T - Technology increases ⬆️
  • E - Expectations of the supplier increase  ⬆️
  • N - Number of competitors decrease ⬇️

If supply decreases (shift to the left) it could be due to the following changes: 

  • R - Resources decrease ⬇️
  • O - Other good prices' increase ⬆️
  • T - Taxes (and other government regulations) increase ⬆️
  • T - Technology decrease ⬇️
  • E - Expectations of the supplier decrease ⬇️
  • N - Number of competitors increase ⬆️

💡Remember: A change in quantity supplied and a shift in supply are two distinct transformations. A decrease or increase of supply happens due to a variety of factors, whereas the change in quantity supplied happens solely due to a change in price. 

Key Terms to Review (9)

Determinants of Supply: Determinants of supply are the various factors that influence the quantity of a good or service that producers are willing and able to sell at different price levels. These determinants can cause shifts in the supply curve, either to the right or left, affecting overall market supply and equilibrium. Understanding these factors helps explain changes in market dynamics, such as how price changes impact producer behavior and how external influences can alter supply conditions.
Equilibrium Price: Equilibrium price is the price at which the quantity of a good or service supplied equals the quantity demanded, resulting in a balanced market. At this price point, there are no surpluses or shortages, and both consumers and producers are satisfied with the transaction. This balance is critical in understanding how supply and demand interact to determine market conditions.
Expectations of the Supplier: Expectations of the Supplier refer to the beliefs or forecasts suppliers have regarding future market conditions, prices, and demand for their goods. These expectations can significantly influence their willingness to produce and supply goods, thereby affecting overall supply in the market. When suppliers anticipate higher prices or increased demand, they are more likely to increase production, while expectations of lower prices or reduced demand may lead to decreased production and supply.
Number of Competitors: The number of competitors refers to the total count of firms that are present in a particular market, influencing supply and pricing dynamics. A higher number of competitors typically leads to increased competition, which can drive prices down and expand consumer choice, while a lower number can create conditions for monopolies or oligopolies, where firms have more control over prices and output levels.
Other Good Prices: Other Good Prices refer to the prices of goods that are related to the supply of a particular product. These prices can influence producers' decisions on how much of a product to supply, as they may substitute or complement the good in question. Understanding how changes in other good prices affect supply is crucial for analyzing market dynamics and producer behavior.
Quantity Supplied: Quantity supplied refers to the specific amount of a good or service that producers are willing and able to sell at a given price within a certain time period. This concept is crucial as it demonstrates how the price of a product influences producer behavior, with higher prices typically leading to a greater quantity supplied. Understanding this relationship helps in analyzing market dynamics and the overall supply curve, which illustrates the quantities supplied at different price levels.
Supply: Supply refers to the total amount of a good or service that producers are willing and able to sell at different prices over a given time period. It plays a crucial role in determining market dynamics, as it interacts with demand to establish prices, quantities produced, and overall market equilibrium.
Taxes: Taxes are mandatory financial charges or levies imposed by governments on individuals, businesses, and property to fund public services and government operations. They play a crucial role in shaping economic behavior, influencing consumer spending, and determining the allocation of resources in the economy.
Technology: Technology refers to the application of scientific knowledge for practical purposes, especially in industry. It plays a crucial role in improving productivity, enhancing efficiency, and driving innovation, which in turn can lead to sustained economic growth, influence supply dynamics, and affect long-run aggregate supply by shifting the potential output of an economy.